Tuesday, April 29, 2008

How do the North Carolina Polls Compare to the Composition of Early Voters?

In the last two days, surveys of North Carolinians have shown a 12 point Obama lead (Public Policy Polling), a 10 point Obama lead (American Research Group) and a 5 point Obama lead (Survey USA). So far, we aren't seeing the widely divergent polling results that we had about a week before the Pennsylvania primary. On the other hand, there is a big difference between a 5 point Obama lead and a 12 point lead. After all, the former will be seen by pundits as a Clinton win while a double-digit margin would be enough for Obama to claim victory.

For the surveys leading up to Pennsylvania, I blogged about comparisons between the demographic compositions of the samples drawn by different pollsters. I present some similar comparisons here between the last three polls taken in North Carolina. However, North Carolina's Board of Elections offers us an additional interesting tool in evaluating the composition of these surveys' samples--a tally of actual early voters. As of Tuesday morning, over 144,000 voters had cast early ballots in the Democratic presidential primary. The racial, gender, and party balance of those voters is presented in the table below.


For the most part, the composition of the pollsters' samples appear to be fairly close to that of those who have voted early so far. However, there are some small differences. For example, each polling organization has African Americans comprising one-third of their sample, but so far they have made up 37% of early voters. In addition, 59% of early voters have been women, but the pollsters samples are comprised of slightly fewer women. On the whole, when it comes to race, gender, and party registration, American Research Group appears to have a sample that most closely mirrors the composition of early voters. However, it is important to note that the differences across polling organizations are not major.

One final important point to make is that early voters are not necessarily a representative cross-section of the eventual electorate. Research suggests that those who take advantage of early voting tend to be of higher socioeconomic status than the regular electorate. Only 4.5% of registered Democrats have voted early so far while about 1.8% of those registered as unaffiliated have early voted in the Democratic primary. Bottom line: the early voting figures may be a guide to the eventual composition of the electorate, but right now they represent just a small share of everyone who will eventually vote in this primary.

Monday, April 28, 2008

Answering Questions About the Superdelegate Predictions

Since I've begun generating the Superdelegate predictions, I've gotten several questions from readers about how I generate the predictions or why various things are missing from the model. For some of the questions, you might find answers in Carl Bialik's recent blog posting about this site. I've also taken a stab at three questions below...

1) What about John Edwards (or other missing superdelegates)?

We originally left out special superdelegates, like John Edwards (CORRECTION: John Edwards is NOT a superdelegate), who are in their position because they are a former president, speaker of the House, etc. The issue with these delegates is that unlike active politicians, they don't have an obvious constituency, which makes their behavior far less predictable.

If you were assume that John Edwards' constituency is the people of North Carolina, then the model would likely predict that he would support Obama (as it does for other male politicians from North Carolina). However, he is a bit of a free agent since he doesn't really have to answer to any particular group, and that makes it far more difficult to model his behavior (or that of other superdelegates like him).

CORRECTION: Thanks to Matt from the Democratic Convention Watch site for pointing out that John Edwards is NOT a superdelegate. Being a VP candidate on a losing ticket does not qualify you for a vote. Since we took our superdelegate list straight from the Democratic Convention Watch website, Edwards has never been in our dataset, so this has not affected our predictions.

2) Why is race not also included in the model? I would expect that it would have similar predictive power to sex.

When my research assistants originally collected the data for these models it was very hard to find information like race on some of the superdelegates who are not governors or members of Congress. Many of these superdelegates were not well known and google searches revealed little to us about their race or ethnicity. This remains true about at least some of the superdelegates. Therefore, we had to exclude this variable from the model. If there is a central source of information that would allow us to fill in the holes on the race of superdelegates, let me know and we will add it to the model.

For what it's worth, I re-ran the model with the superdelegates that I did know the race of and found that the race of the superdelegate was NOT a statistically significant predictor of who a superdelegate chose to support.

3) Does your methodology take into account the fact that a large number of pledged superdelegates made their commitments (primarily) to Clinton prior to anyone believing that there would be a viable alternative candidate?

We use a two-stage model that allows us to account first for the factors affecting whether a superdelegate has endorsed at all and then estimates which candidate that superdelegate endorsed (if he/she has endorsed). To some extent, this should pick up some of the fact that potential Clinton endorsers were more likely to have already endorsed while more potential Obama supporters may be waiting to make sure he is going to actually pull out the nomination. Nevertheless, in recent works I have begun considering a different approach, by attempting to model when superdelegates made their decisions (for example, before or after Super Tuesday) and include that as a factor in the model. I may do that in the next iteration of the predictions.

Thanks for the questions, and let me know if you have more.

Early Voting for North Carolina Presidential Primary

The North Carolina State Board of Elections does something very cool--they put all of their early voting data up on their website for easy download. So, of course I just had to download the data this morning and do a little crunching to see what types of people are voting early for the May 6th primary.

Based on the data I downloaded this morning, 144,440 voters have cast valid early ballots so far in North Carolina. Of that number, 117,655 have requested a Democratic ballot for the primary (only 26,371 have requested a Republican ballot, with the rest taking an unaffiliated ballot). Based on party registration figures included in the data, 68.6% of early voters are registered Democrats, 16.1% are registered Republicans, and 15.3% are registered as unaffiliated. 84% of the early voters who are registered as unaffiliated voted in the Democratic party. These voters make up 15.8% of those who have already voted in the Democratic primary with Democrats making up the rest.

The great thing about this data is that it includes the race and gender of those who have voted early, so we can take a look at a few different demographics. The table below presents the racial and gender makeup of early voters in North Carolina so far:


% of Early Voters
White 59.10%
Black 37.20%


Male 40.40%
Female 59.10%


White Men 25.20%
White Women 33.70%

It certainly bodes well for Barack Obama that over one-third of the early voters are African American, since this group has supported him at such a high rate. White women, on the other hand, have been a very strong group for Hillary Clinton, and they also make up one-third of the early voters in the state.

I'll present some more information from these data as the week goes on.

Saturday, April 26, 2008

Updated Democratic Superdelegate Predictions

UPDATED AT 9:45PM ON APRIL 26TH

I have now had a change to update the superdelegate predictions. As always, I use information about the superdelegates who have committed to a candidate to generate predictions for the remaining unpledged superdelegates. I exclude superdelegates from DC and the territories because we lack complete data from those areas, and from IL, NY, and AR because superdelegates in those states have nearly unanimously cast their support for their native son/daughter. As always, information on the superdelegates is provided by the Democratic Convention Watch site. You can find more about the methodology I use here. Since I began generating these predictions, 106 superdelegates have announced their endorsements, and we have been correct on 74 of these. Thus, overall, the models have been correct 70% of the time.

In addition to adding the newest endorsements to the model, I have also added information about the add-on superdelegates who have been designated at this point. We are unable to predict how most add-ons will vote since we don't know who they are yet. But I added those who have been selected to the model (most add-ons have already endorsed one of the candidates).

In the figure below, I present the distribution of unpledged superdelegates based on the probability of supporting Clinton:Superdelegates who are between 40% and 60% likely to vote for Clinton/Obama are labeled as "unclear." There are 77 superdelegates in this range. There are 129 unpledged superdelegates who are at least 60% likely to vote for Obama; just 38 unpledged superdelegates are at least 60% likely to vote for Clinton. These predictions suggest that unless something dramatically changes, Obama will be able to cut into and even overtake Clinton's superdelegate lead in the coming weeks and months.

The estimates for each unpledged superdelegate are listed here. These estimates show that among Obama's most likely endorsers are Rep. Dennis Moore (KS), Rep. Michael Michaud (ME), and Rep. Tom Allen (ME). Clinton's most likely endorsers include Reps. Jerry McNerney, Susan Davis, and Lois Capps (all from CA).

UPDATE: I updated this information to reflect that fact that my original data had Patrick Lynch as undeclared (when he has, in fact, endorsed Obama).

Thursday, April 24, 2008

Michigan and Hillary Clinton's Popular Vote Claim

There has been much discussion since the Pennsylvania primary of the Clinton campaign's claim that she is now ahead in the popular vote. Of course, this only happens when you figure in Michigan and Florida into the count, and only when you do it in a very specific way.

According to MSNBC, the popular vote with every state included except Michigan (i.e. every state where Obama was at least on the ballot) breaks down like this:

Obama: 15,016,607
Clinton: 14,822,400

If you include all of Clinton's Michigan vote and nothing in Michigan for Obama (who was not on the ballot there), then you get a Clinton lead (this is the metric being promoted by the Clinton campaign):

Clinton: 15,150,551
Obama: 15,016,607

Of course, most people are looking at this metric with a great deal of skepticism. Of the 593,837 Democrats who turned out to vote in the Michigan primary, 55% (328,151) cast their vote for Clinton. But what would have happened if all the candidates' names had been on the ballot? Fortunately, we have exit polls from Michigan which can give us some insight here. On the exit poll survey, voters were asked who they would have voted for had every candidate's name actually been on the ballot. Here are the results:

Clinton: 46%
Obama: 35%
Edwards: 12%

So, what happens if re-allocate the Michigan vote accordingly? In Michigan, the vote would have broken down as follows:

Clinton: 273,165 votes
Obama: 207,843 votes
Edwards: 71,260 votes

Thus, had Obama's name been on the ballot, Clinton's margin in the state would have been much smaller. Of course, there is no really good metric for measuring the vote in Michigan. Even in this scenario we have to assume that turnout wasn't suppressed by the fact that Obama's name wasn't on the ballot. Yet, you can imagine that many Obama supporters (and some Clinton supporters) may not have bothered to turn out to vote given that they knew that their votes were not likely to count. Nevertheless, this metric probably comes closest to capturing the actual preferences of those who did turn out to vote in Michigan.

So, how big a difference does this make in calculating the popular vote nationwide? If you add in the Michigan vote using the reallocation based on the exit polls, then you get the following national count:

Obama: 15,224,450 votes
Clinton: 15,095,565 votes

That would give Obama a lead of more than 120,000 votes nationwide, a lead that would be difficult for Clinton to overcome in the remaining states.

Wednesday, April 23, 2008

Post from Public Policy Polling on their Pennsylvania Poll

The folks at Public Policy Polling posted last night to discuss why their survey showing Obama beating Clinton in Pennsylvania was so off the mark. They note that their over-representation of voters in the 18-45 age group was a big factor in throwing off their results, something I noted before the primary.

Tuesday, April 22, 2008

Election Night Thoughts on Pennsylvania

12:11am: Ok, this mini-live blog is over for the night. It looks as if the 9 or 10% margin will stick. I'll leave you with this interesting post from the Politico. It turns out that Mr. Super is a reader of this blog (or of our Superdelegate predictions, at least). I'd love for more superdelegates to reveal their preferences, if only so we could figure out how well our model really did.

How do you measure tonight's results? Here are a few ways:

1) Clinton will pick up about 12-15 pledged delegates from PA. The bad news for her is that at this rate she will be able to over-take Obama's pledged delegate lead some time in 2012.

2) That fact is of some solace to the Obama campaign, but they cannot be happy about their inability to deliver a definitive knock out punch. Their best shot at doing so comes on May 6th.

3) The Obama campaign expected that they would lose PA by a spread of 52-47%. Thus, by their own expectations, they did twice as badly as they thought they would.

And with that, goodnight. I promise you I won't be live-blogging Guam.

10:43pm:
Looking ahead, the polls show a tight race in Indiana and the Pollster.com average in NC shows Obama up by about 20%. The pundits appear to be saying that she has to win both to stay in. Question: if she narrowly wins Indiana but does lose NC by 20%, will she still stay in the race? Another question: can she cut into a large Obama lead in NC the way that he cut into her leads in PA and OH?

10:25pm:
Clinton is hitting hard on the spending disadvantage she suffered in PA. It is a way to make her look like the hard fighting underdog, which is quite a turn from where we were 5 months ago.

9:54pm:
The lead is hovering between 6 and 10% with almost half the precincts in so far. If it stays at or above 10%, Clinton may get a nice bump from this victory. If less, than this probably doesn't change the dynamics of the race at all (other than extending it for at least two more weeks).

Tim Russert reports that the Clinton campaign is asking for $5 donations tonight via email. Are we now in a place where the candidates are scrambling to see who can get the smallest donations (with the most donors)? Should the Obama campaign begin soliciting $1 donations?

9:20pm:
Just a thought about how this will be spun. The networks have little else to do for the next several hours other than watch how Clinton's margin ebbs and flows. How does this effect how the outcome will be framed by the media? Well, on one hand, if everyone goes to sleep thinking Clinton won big, then that may be the story. On the other hand, and possibly more likely, if she has a big lead early in the night, but it narrows significantly, will the final margin be discounted to some extent (since it had been bigger earlier on)? We live in a 24 hour cable news world where it probably matters matter which votes are counted first. Surely you can imagine Keith Olberman at 11pm saying something like, "wow, Obama has really cut into Clinton's vote margin in the past hour."

9:13pm:
Marc Ambinder from the Atlantic notes how the networks were able to make the call despite no real vote in yet:

"They're merging the exit poll data with quick tallies from specially selected model precincts across the state. Clinton in those precincts is outperforming her margin in the exit polls."

8:59pm:
All the networks are falling into line now and calling PA for Obama. Blumenthal over at Pollster.com made an interesting point about how the key thing the networks are working on in getting their exit polling right is how to weight the data they have geographically. In other words, how much weight do they give to their Philadelphia interviews versus those from Pittsburgh or other areas? If they under- or over-weight a particular region relative to actual turnout in that area, it could be problematic. Of course, just after I read that, the networks began calling the state for PA, so they must've figured it all out ok (or else they are going to look pretty bad).

EARLIER: Ok, I promised myself I wouldn't do a live blog for tonight, but I can't resist posting a few thoughts tonight. Here is the first one:

The early exit polls are showing that 9% of the Democratic electorate changed their registration to Democrat from Republican before the primary. Another 4-5% were newly registered and voting for the first time in PA. Obama won those voters by a margin of 60-40%. This certainly helped Obama cut into Clinton's lead.

Age Breakdown of the Early Exit Polls in Pennsylvania: Good News for Clinton?

I noted yesterday that many of the differences in the pre-election polling in Pennsylvania appeared to be related to the assumptions that pollsters were making about the age-breakdown of the electorate. Public Policy Polling was the only survey showing an Obama lead, and they were also assuming a much higher share of the electorate (41%) was going to be between 18-45 years of age compared to the other pollsters (who were assuming a number around 20%). Well, the early exit polls hold good news for Clinton. These polls are showing that 27% of the electorate was in the 18-45 age group. This figure is much smaller than the Public Policy Polling sample, but pretty close to the Quinnipiac figure, which was 24%. Quinnipiac showed a 51-44% lead for Clinton in their last survey, so it will be interesting to see if they come close to the actual figure.

UPDATE (8:29pm): The exit poll figures have changed somewhat (or I misread them earlier). They are now showing that 31% of the electorate was in the 18-45 age group. As that number creeps higher, Obama may do better.

Final Pennsylvania Delegate Prediction: Clinton 84, Obama 74

Pollster.com's final poll average for Pennsylvania shows Clinton at 49% and Obama at 43%. If you use these figures to extrapolate on how delegates will be awarded, Clinton should receive 84 of the state's pledged delegates compared to 74 for Obama. If this holds, Clinton will cut 10 pledged delegates off of Obama's lead, which would keep him well ahead of her in both pledged and total delegate tallies.

Monday, April 21, 2008

Is the Age of the Electorate the Key to Understanding the Erratic Pennsylvania Polls?

There has been a lot of attention paid to the divergent polling results recently, including on this blog (here and here; see numerous posts on Pollster.com as well). As I've noted before, one reason for these divergent results may be due to the way that polling organizations are defining who is a "likely voter."

Rasmussen Reports notes the significance of these decisions when discussing their latest survey:

"It is far more challenging to project turnout in a Primary Election than a General Election. [...] The degree to which actual turnout varies from these [demographic] figures could have a significant impact on the final results."

For the most part, the survey firms appear to be coming up with relatively similar figures for the percentage of women vs. men (most are assuming about 55-60% will of the electorate will be women) and whites vs. African-Americans (most are assuming that about 80% of the electorate will be white and 15% African-American).

There does, however, appear to be some significant differences in the age breakdown of the samples being gathered by these pollsters. Unfortunately, it is sometimes difficult to compare different samples by their age breakdown because different organizations use different cut points. But let's take 3 firms where we can make comparisons.

Public Policy Polling (PPP) used an automated polling method to collect over 2,000 interviews during the weekend. They are the one firm today reporting an Obama lead (47-43%). Interestingly, the 18-45 age group made up 41% of those they polled.

On the other hand, Suffolk University conducted a poll during the same two days this weekend but they turned up a 52-42% lead for Clinton. One way to account for the major difference between these two polls is that in the Suffolk poll voters in the 18-45 age group comprised just 19% of their sample. That means that Suffolk is expecting a much older electorate tomorrow than PPP. Both firms see Obama winning the younger age group by a significant margin (49-41% in the PPP poll and 56-40% in the Suffolk survey), but Suffolk thinks that they will make up only one-fifth of the electorate while PPP believes that they will be 41% of the electorate.

Quinnipiac, who conducted interviews from Friday through Sunday, has Clinton winning Pennsylvania by a margin of 51-44%. Their poll also finds that Obama will win the 18-45 age group by a significant margin, but based on a little backwards induction, I determined that citizens between 18 and 45 years old comprised 24% of the sample.

Bottom line: pollsters do not appear to be drawing consistent samples by age and such decisions can dramatically affect the results that are being reported. PPP has Obama winning because its sample is much younger than that captured by Quinnipiac or Suffolk. The real question is, which firm is closer to having the right mix of old and young? We won't know until we see the exit polls tomorrow night, but the answer will likely determine the outcome in Pennsylvania.

New Pennsylvania Registered Voters--County-by-County

The Politico has a great county-by-county map of the changing party registration picture in Pennsylvania. It may come in handy tomorrow night as we watch the county-by-county results come in.

Friday, April 18, 2008

New Democratic Superdelegate Predictions

As promised, I've updated the superdelegate predictions that I've been generating from time-to-time during this primary campaign. Before I get to the new predictions, it is worth checking in on how well the model has been doing in predicting who superdelegates are supporting. Of the 14 superdelegate endorsements made since our last predictions, we correctly predicted 11 and missed only 3 (Note: There were several other superdelegate endorsements, but we do not make predictions for superdelegate add-ons or for superdelegates in IL, NY, or AR). Overall, since we began generating these predictions, 96 superdelegates have announced their endorsements, and we have been correct on 68 of these. Thus, overall, the models have been correct over 70% of the time.

You can see who we got right and who we got wrong here:


Name State Office Actual Prediction


Steven Alari CA DNC Obama Clinton


Amy Klobuchar MN Senator Obama Obama


Nancy Larson MN DNC Obama Obama


Jean Lemire Dahlman MT DNC Obama Obama


Hon. Margarett Campbell MT DNC Obama Obama


Rep. David Price NC House Obama Obama


Rep. Mel Watt NC House Obama Obama


William Burga OH DNC Clinton Obama


Bob Casey PA Senator Obama Obama


Hon. Richard Donatucci PA DNC Clinton Obama


Hon. Sophie Masloff PA DNC Clinton Clinton


Hon Al Edwards TX DNC Obama Obama


Wayne Holland Jr UT Chair UT DNC Obama Obama


Dave Freudenthal WY Governors Obama Obama

Now on to the new estimates. As before, I use information about the superdelegates who have committed to a candidate to generate predictions for the remaining unpledged superdelegates. I exclude superdelegates from DC and the territories because we lack complete data from those areas, and from IL, NY, and AR because superdelegates in those states have nearly unanimously cast their support for their native son/daughter. As always, information on the superdelegates is provided by the Democratic Convention Watch site. You can find more about they methodology I use here.

Check out the distribution of predicted support among unpledged superdelegates below.
Superdelegates who are between 40% and 60% likely to vote for Clinton/Obama are labeled as "unclear." There are 74 superdelegates in this range. There are 175 unpledged superdelegates who are at least 60% likely to vote for Obama; just 7 unpledged superdelegates are at least 60% likely to vote for Clinton. These predictions suggest that Obama will be able to cut into and even overtake Clinton's superdelegate lead in the coming weeks and months. Unless something significant changes, there seems to be little hope for the Clinton campaign in hoping that the superdelegates will help her erase Obama's lead.

The estimates for each unpledged superdelegate are listed here. These estimates show that among Obama's most likely endorsers are Rep. Dennis Moore (KS) and Rep. Tom Allen (ME). Clinton's most likely endorsers include Reps. Jerry McNerney, Susan Davis, and Lois Capps (all from CA).

Thursday, April 17, 2008

New Democratic Delegate Predictions for Pennsylvania and Beyond

There has been no shortage of polling in Pennsylvania recently. Of course, as I've noted in earlier posts (as have others), this polling has been all over the map. How does this effect the estimates of how Pennsylvania's pledged delegates will be divided? Well, consider the following. If the most recent Survey USA poll from Pennsylvania (which shows a 54-40% advantage for Clinton) is correct, then Clinton would capture a net gain of approximately 24 delegates from the state's primary. On the other hand, if Public Policy Polling (which shows a 45-42% Obama advantage) is more accurate, then Obama would take a 6 delegate net gain from the state.

Of course, it has been our tradition to generate delegate predictions based on Pollster.com averages of all the recent polling in each state. For Pennsylvania, this average currently stands at 47-42% in favor of Clinton. If that division holds up, then Clinton would win approximately 83 delegates from the state compared with 75 for Obama, a net gain of 8 delegates.

Using the polling data in the upcoming states, we can also project further ahead. This information is presented in the table below. I use the Pollster.com averages in Pennsylvania, Indiana, and North Carolina, where there have been several polls conducted. In West Virginia, Kentucky, and Oregon, I simply use the most recent survey.

Note that based on these projections, any gains made by Clinton in Pennsylvania and Indiana will be made up for by Obama's large lead in North Carolina, where he is currently projected to pick up 23 delegates. Clinton is set up to pick up big gains in West Virginia and Kentucky, but Obama is favored in Oregon. Altogether, the estimates show that if Clinton remains in the race for the next month, she will make very little headway in cutting into Obama's lead, with a net gain of fewer than 20 pledged delegates in the next six contests.

Finally, the graphic below shows the projected pledged delegates that Obama will accumulate over the next month or so. The line drawn at 1,627 indicates that point at which Obama will have accumulated a majority of the total pledged delegates available (not including Florida and Michigan). The 1,627 mark may end up being a significant milepost in the discussion about when Clinton should leave the race.


Finally, it has been a while since I updated the superdelegate predictions. I am hoping to find time to put together some new predictions tomorrow.

Wednesday, April 16, 2008

Those Erratic Pennsylvania Polls

I put together the figure below to show just how erratic these Pennsylvania polls have been. Below are surveys conducted within the last week. None of these surveys has Obama breaking the 45% barrier, but Clinton's support varies from greater than 55% in the American Research Group poll to 42% in the latest Public Policy Polling survey.

UPDATE: Mark Blumenthal has posted a much better scatter plot of the recent polling in Pennsylvania along with a column on the topic. Definitely worth checking out.

Tuesday, April 15, 2008

"Philadelphia and Pittsburgh with Alabama in Between?" Not Exactly

After five weeks of discussing the upcoming Pennsylvania primary, James Carville's adage about Pennsylvania has become well-known and oft-repeated. But to what extent is it truly the case that Pennsylvania consists of three distinct areas: Philadelphia, Pittsburgh, and the rest of the state (and that the rest of the state looks like Alabama)? To get a sense of this, I divided the state into three parts: the Philadelphia media market (in blue), the Pittsburgh media market (green), and the rest of the state (red).


The chart below shows how citizens in these three parts of the state rate on the various cultural measures that I used to compare PA to other states in earlier posts (using data from the Cooperative Congressional Election Study). Note that the percentage of Democrats is virtually the same across the state. However, the different parts of the state vary significantly on other measures. In fact, the Philadelphia market appears to be quite distinct in many ways while Pittsburgh can be more closely compared to the rest of PA. Philadelphia citizens are much less likely to be regular Wal-Mart shoppers and much less likely to own a gun or pickup truck compared to those in the rest of the state. They are also significantly more likely to have a favorable opinion of Jon Stewart. On the other hand, Pittsburgh citizens aren't that distinct from those in Carville's "in between" areas.


I also decided to test whether the "in between" parts of Pennsylvania were really similar to Alabama. This comparison is presented in the chart below. As you can see, middle Pennsylvania appears to be quite different from Alabama. Politically, middle PA is much more Democratic than Alabama. Alabama also has a much higher percentage of regular Wal-Mart shoppers and pickup truck owners. People in middle Pennsylvania are also more likely to own stocks, less likely to own a gun, and rate Jon Stewart much more favorably than Alabamans.


Thus, there appears to be little support for Carville's claim that Pennsylvania is "Philadelphia and Pittsburgh with Alabama in between." In fact, middle-PA and Pittsburgh are not all that different from each other and middle-PA is quite different from Alabama in a number of ways.

Monday, April 14, 2008

How Does Pennsylvania Compare? Part III: Gun Owners and Jon Stewart

This is the third part in my three part series on how Pennsylvania compares on a variety of cultural measures. I noted in Part I that Pennsylvania is most like Florida, Wisconsin, Virginia, Delaware, Ohio and Illinois when it comes to the percentage of Wal-Mart shoppers and pickup truck owners. In Part II, I demonstrated that Pennsylvania was closest to Wisconsin when it came to PBS viewership and stock ownership. In this post, I will examine how Pennsylvania compares on the percentage of its population that owns a gun and the average rating that its citizens give Jon Stewart on a scale from 1 to 7 (with 7 being most favorable). I've plotted the states on these two measures below:
As with the other measures I've looked at, these two variables are also related to each other. States with higher gun ownership are less favorable toward Jon Stewart while those with more gun ownership are less favorable. Pennsylvania appears to rank near the middle of the pack with regard to gun ownership and feelings about Jon Stewart. Wisconsin, Maine, Ohio and Virginia are all very close to Pennsylvania on these measures.

Wisconsin stands out as the one state that has been consistently close to Pennsylvania on all six of these measures. Virginia and Ohio were also close to Pennsylvania on most, but not all measures. Wisconsin was most similar to Pennsylvania on ratings of Jon Stewart, the percentage of stock owners and the percentage owning a pickup truck. Ohio was most like Pennsylvania when it came to the percentage of citizens who shop at Wal-Mart regularly but it ranked much lower when it came to the percentage of the state's population that were invested in the stock market. Virginia looked very much like Pennsylvania when it came to Wal-Mart shoppers and the percentage of gun owners, but Virginia had more stock owners and PBS watchers than Pennsylvania.

The media and pundits are likely focusing on the Pennsylvania and Ohio comparison because of the geographic closeness of the states, but perhaps a Pennsylvania-Wisconsin comparison is more apt, at least when it comes to some of these cultural measures. Whether Pennsylvania will vote more like Ohio or Wisconsin remains to be seen.

Sunday, April 13, 2008

How Does Pennsylvania Compare? Part II: Stocks and PBS

This is the second part in my three part series on how Pennsylvania compares on a variety of cultural measures. I noted in Part I that Pennsylvania is most like Florida, Wisconsin, Virginia, Delaware, Ohio and Illinois when it comes to the percentage of Wal-Mart shoppers and pickup truck owners. In this post, I'll look at the percentage of citizens in each state who watch PBS (at least occasionally) and the percentage who say that they are invested in the stock market. Each state is plotted on these dimensions below:
Again, these two measures seem related to each other, though there are some outliers. In particular, few residents of Washington, DC appear to watch PBS but a high percentage are invested in the stock market.

On these measures, Pennsylvania is closest to Wisconsin, a state that it also ranks close to on Wal-Mart shoppers and pickup truck owners. Of course, Obama won Wisconsin 58-41% and there is really no indication that he will be able to pull off such a victory in Pennsylvania much less win the state at all. But it is interesting to see that on these four measures I've plotted so far, Pennsylvania is consistently closer to Wisconsin than it is to Ohio or other states that it has been compared to by pundits and analysts.

Don't worry, I'm not finished yet. In Part III of this series (coming early this week) I'll look at gun ownership and feelings toward Jon Stewart.

Thursday, April 10, 2008

How Does Pennsylvania Compare? Part I: Wal-Mart and Pickup Trucks

One question I've gotten from a lot of reporters I've talked to during the past month is "which states is Pennsylvania most similar to?" The idea, of course, is to get a sense of which candidate will win Pennsylvania by looking at how other states like Pennsylvania voted. The problem is that nobody can really figure out what state Pennsylvania is comparable to. After all, as anyone who has ever driven from Ohio to New York can tell you, Pennsylvania is a very long state. As a result, the eastern part of the state is in the Mid-Atlantic while the western part of the state is in the Midwest; I've lived in both the Mid-Atlantic and the Midwest, and they are worlds apart in many ways.

So, I've decided to do a little empirical work on figuring out which states Pennsylvania is most comparable to. But I'm not looking at the same old boring party identification or presidential vote measures. Instead, I'll look at Wal-Mart shoppers and Pickup truck ownership in this post. That's right, I'm looking at some seemingly non-political measures...maybe something getting more at the state's culture.

Using the Cooperative Congressional Election Study (conducted in 2006) I've plotted the percentage of respondents in each state who shop at Wal-Mart regularly along with the percentage who own a pickup truck.
As you can see from the figure, the percentage of Wal-Mart shoppers in a state is related to the percentage of pickup truck owners. Pennsylvania is about average when it comes to Wal-Mart shoppers, and the state ranks below most states in pickup truck ownership. On these measures, Pennsylvania is most like Florida, Wisconsin, Virginia, Delaware, Ohio and Illinois. And, of course, Obama won four of those states (WI, VA, DE, and IL) while Clinton won two (FL and OH).

In part 2 (now posted here), I'll look at the percentage of a state that watches PBS and the percentage that owns stocks. Stay tuned...

Tuesday, April 8, 2008

Why are the Pennsylvania Polls so Erratic?

Three surveys released for the Pennsylvania Democratic primary in the last few days have many political analysts scratching their heads. Quinnipiac's poll (conducted April 3-6) has Clinton up by 6% over Obama. Survey USA's poll (conducted April 5-7) has Clinton up by 18% over Obama. And American Research Group's poll (conducted April 5-6) has the race tied. This is an incredible amount of variation for polls taken within the same few days, so what gives?

One possibility we can probably rule out is the difference between live and automated interviewers. Both Survey USA and American Research Group used the automated technology, and their estimates of the gap between Obama and Clinton are 18% apart. It also appears as though all three organizations used random digit dialing rather than working from a registration list (which is good since those registration lists have changed quite a bit in PA over the last few weeks).

Question wording is another possibility. Here is a comparison of each organization's question:

Quinnipiac: "If the 2008 Democratic primary for President were being held today, and the candidates were Hillary Clinton and Barack Obama, for whom would you vote?"

Survey USA: "If the Democratic Primary for President of the United States were today, would you vote for...(names rotated) Hillary Clinton? Barack Obama? Or some other Democrat?"

American Research Group: "If the 2008 Democratic presidential preference primary were being held today between (names rotated) Hillary Clinton and Barack Obama, for whom would you vote - Clinton, Obama, or someone else?"

Nothing obvious stands out from those questions...all are asked in slightly different ways, but none in a way that seems to explain such major differences.

To gain some insight into what might be causing these divergent results, we can take a look at some basic demographic breakdowns from each survey. Each survey tells us how preferences were divided by gender, race, and age. Survey USA and American Research Group also add information about the percentage of their sample that was comprised by each of those groups, I had to do a bit of backwards calculation to get that information for the Quinnipiac survey. The table with this information is here:


The first thing to look at is the composition of each sample. Note that there are not major differences here. Survey USA does have the highest percentage of women; this can account for some of the discrepancy between this poll and the others, but not all of it. Survey USA also differs from American Research Group in its assumption that more than half of the electorate will be older than 50. Again, this can explain some of the discrepancy in that survey, but not all of it.

What may be more notable is that among various subgroups, the samples appear to find very different preferences. For example, support for Clinton among women ranges from 52% in the ARG sample to 61% for Survey USA. Combine that difference with the different percentages of women sampled, and we begin to really account for a lot of the different findings. Note also that support for Clinton is 38% among the 18-45 group in the ARG survey, but 52% with the Survey USA sample. Thus, the differences in the survey results are not just a matter of how the organizations are defining their samples, but also a function of the fact that they are finding very different vote patterns among the same demographic groups. However, what remains a mystery is why this is the case.

I'm largely stumped on this one. One explanation is simply that the organizations are using very different screening to determine who is and isn't a likely voter. It may also be the case that the Survey USA poll is a bad sample. The thing that stands out for me with this sample is the breakdown for the 18-45 age group; it seems a little odd to see Clinton up by 11% with this group. The last Survey USA poll also showed a narrower race than this one. This stands out since almost every other organization polling consistently in the state has showed a race that is consistently narrowing.

Any thoughts?

UPDATE: Mark Blumenthal has some discussion of these Pennsylvania polls as well (here and here).

UPDATE 2: Two new surveys out (PPP and Strategic Vision) both have the race in PA close (3 points in one poll, 5 in the other); this suggests that the Survey USA poll really is the outlier. Question remains...will it be the correct outlier?

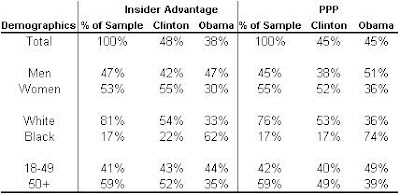
UPDATE 3: I've put together some data on the PPP and Insider Advantage surveys released from PA in the last couple of days. Survey USA appears to be giving Clinton a bigger advantage among women and whites than any other survey, and Survey USA is the only poll that gives Clinton an advantage among the 18-45 or 18-49 age group.

Monday, April 7, 2008

New Oregon Poll: Obama 52%, Clinton 42%

SurveyUSA just released the first survey out of Oregon since late January. The survey shows that Barack Obama currently holds a 10% lead over Hillary Clinton. His support comes largely from males, with whom he enjoys a 62-32% advantage. He also carries every age group except the over 65 crowd. Interestingly, 70% of the respondents indicated that their mind was made up, and that group preferred Obama by a margin of 54-43%. Among those who might still change their mind, Obama led by just 44-41%.

We now have at least one recent survey in every state that is holding a primary between now and May 20th. I will publish updated delegate estimates soon, but the bottom line appears to be that if these polls up, Clinton will not be able to make any significant inroads into Obama's delegate lead over the next 6 weeks.

Watch the CCPS Conference on Party Conventions

I'm back after spending much of last week at the Midwest Political Science Association's annual conference. Thanks for putting up with my lack of posts while I was away.

The Center for Congressional and Presidential Studies held a conference on party conventions last week and the bright lights of the C-SPAN cameras were there to capture it. You can watch the panels online by clicking on the links below (even though I was on the second panel, I think the third panel was the most interesting of the three, providing a lot of insight into Democratic delegate selection rules):

Panel I: The 2008 Conventions in Historical Perspective: Do Conventions Still Matter?

Mike Berman, president of the Duberstein Group who has worked on every Democratic National Convention since 1968
Billy Pitts, president of Government Affairs at the NTI Group, and assistant parliamentarian at four Republican conventions
Costas Panagopoulos, assistant professor at Fordham University and author of Rewiring Politics: Presidential Nominating Conventions in the Media Age (2007)


Panel II: The Changing Role of Media at Conventions

Ron Elving, NPR Washington Editor
Dotty Lynch, AU School of Communication Executive in Residence and former Political Director of CBS News
Brian F. Schaffner, assistant professor at American University and co-author of Politics, Parties & Elections in America (2008)

Panel III: The Role of Delegate Selection and Convention Rules

Anthony Corrado, professor of Government at Colby College
Tad Devine,
founder and partner of Devine Mulvey and Democratic strategist
James A. Thurber,
distinguished professor of Government at American University and Director of the Center for Congressional and Presidential Studies

Tuesday, April 1, 2008

New Democratic Delegate Predictions (Estimates Through May 20th Based on Current Survey Data)

It has been a while since I produced the last delegate estimates for the upcoming Democratic primaries. Part of the reason for that is because the upcoming Democratic primaries are still several weeks off. Another reason is that there really hasn't been enough polling in several states such as Indiana, West Virginia, and Kentucky. However, a slew of new polls have come out in the past week or so, providing pretty good coverage of the upcoming primary states (except for Oregon, where there has not been a poll since January).

In Pennsylvania and North Carolina, we have several polls, so I use the Pollster.com averages. In Indiana, West Virginia, and Kentucky, I use the most recent poll in each state. Based on these polls, Hillary Clinton would pick up about 230 delegates through the May 20th primaries compared to 194 for Barack Obama (with 52 delegates in Oregon listed as "unclear" because there is no recent survey data available).

This means that by May 20th, Clinton will have been able to cut about 36 delegates off of Obama's pledged delegate lead (which currently stands at 162). That means he would still have a lead of more than 100 pledged delegates by May 20th (with only three states voting after that date).

On Monday, I used the Obama campaign's delegate predictions to estimate that he would clinch a majority of pledged delegates on May 20th. The poll-based delegate predictions lead to a similar conclusion. If you assume the delegate allocations predicted above from the state-by-state surveys, and then split Oregon's delegates evenly (since we have no polling data on the state), then on May 20th, Obama would have 1,637 pledged delegates, 10 more than he needs to clinch a majority of pledged delegates (I am assuming Obama will win 2 of Guam's 4 delegates on May 4th).

New Indiana Poll: Clinton up by 9% over Obama

We finally get a poll out of Indiana after going nearly two months without one. SurveyUSA released the survey this afternoon showing, perhaps somewhat surprisingly, that Clinton presently holds a 9% advantage over Obama in the state 52-43%. Clinton appears to have the advantage among most demographic groups. She is winning women by 17% (and men by 2%) and whites by 21%. Obama is winning the 18-34 crowd, but Clinton is winning all other age groups.

Now that we have a recent Indiana survey, I'll be posting new delegate estimates tonight. However, blogging will be light the rest of the week as I will be at the Midwest Political Science Association Meeting in Chicago.

More on those Democratic Defectors

The New York Times has a nice story today that, among other things, gives some nice historical context to the question of party defectors. The story also refers to some of the data that I presented last week on this blog. Definitely worth a read.